
Page 87 - Consolidated Non Financial Statement
P. 87
Banca Ifis
| 2020 Consolidated Non-Financial Statement
[GRI 102-8]
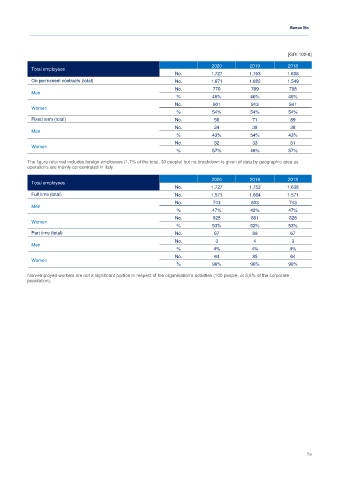
2020 2019 2018
Total employees
No. 1.727 1.753 1.638
On permanent contracts (total) No. 1.671 1.682 1.549
No. 770 769 708
Men
% 46% 46% 46%
No. 901 913 841
Women
% 54% 54% 54%
Fixed term (total) No. 56 71 89
No. 24 38 38
Men
% 43% 54% 43%
No. 32 33 51
Women
% 57% 46% 57%
The figure returned includes foreign employees (1,7% of the total, 30 people) but no breakdown is given of data by geographic area as
operations are mainly concentrated in Italy.
2020 2019 2018
Total employees
No. 1.727 1.753 1.638
Full time (total) No. 1.571 1.664 1.571
No. 743 803 743
Men
% 47% 48% 47%
No. 828 861 828
Women
% 53% 52% 53%
Part time (total) No. 67 89 67
No. 3 4 3
Men
% 4% 4% 4%
No. 64 85 64
Women
% 96% 96% 96%
Non-employed workers are not a significant portion in respect of the organisation’s activities (100 people, or 5,8% of the corporate
population).
79